Following the Leading Index
 The Conference Board’s Leading Economic Index (LEI) is designed to assess the U.S. economic outlook for the next three to six months. Because the LEI is forward looking, businesses and investors may use it to help anticipate what could be ahead and make informed decisions.
The LEI summarizes a large amount of economic data, boiling down the composite averages of 10 key economic indicators to a monthly index number. Up or down movements in the index tend to reveal patterns and turning points more clearly — and with less volatility — than any single indicator.
Swapping Statistics
In January 2012, the 10 indicators that make up the index changed for the first time since 1996. According to The Conference Board, the index had become outdated in light of structural shifts in the U.S. economy over the last few decades.1
Three LEI components were replaced and another had a minor change. Since the adjustments took effect, monthly reports are no longer directly comparable to those released in the past.
- The M2 measure of real money supply was dropped and replaced with the new Leading Credit Index, which monitors financial market conditions using data related to interest-rate swaps, the bond market yield curve, and the Federal Reserve survey of bank lending.
- The Institute for Supply Management (ISM) Supplier Delivery Index was replaced by the ISM New Orders Index.
- The LEI will no longer rely solely on the Reuters/University of Michigan consumer expectations index to gauge consumer sentiment. An equally weighted average of that poll and The Conference Board’s consumer confidence survey will be used instead.
- The new orders for (nondefense) capital goods component now excludes commercial aircraft.
New and Improved
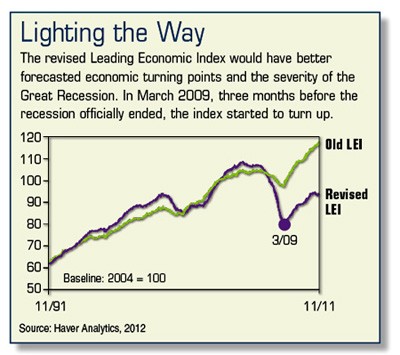
The monthly publication of the LEI itself does not usually have much of an effect on financial markets because many of the statistics are taken from previously announced reports. However, the index does include some new information. Viewed in hindsight, the revisions would have made the LEI a more reliable forecaster of peaks and troughs in the business cycle from 1990 to the present.2
The 10 components of the LEI now incorporate the following closely watched readings of economic activity:
- Average weekly hours by manufacturing workers
- Average weekly initial claims for unemployment insurance
- Manufacturers’ new orders for consumer goods and materials
- ISM Index of New Orders
- Manufacturers’ new orders for nondefense capital goods (excluding aircraft)
- Building permits for new residential units
- Stock prices
- Leading Credit Index
- Spread between long and short interest rates
- Consumer expectations for business conditions
Watched over time, leading economic indicators may provide a general sense of where the economy is heading, but investors should understand that predictions are not always on the money. All investments are subject to market fluctuation, risk, and loss of principal. When sold, they may be worth more or less than their original cost.
1–2) The Conference Board, 2012
The information in this article is not intended as tax or legal advice, and it may not be relied on for the purpose of avoiding any federal tax penalties. You are encouraged to seek tax or legal advice from an independent professional advisor. The content is derived from sources believed to be accurate. Neither the information presented nor any opinion expressed constitutes a solicitation for the purchase or sale of any security. This material was written and prepared by Emerald. Copyright © 2012 Emerald Connect, Inc.

